Total value to paid-in capital (TVPI) is the headline multiple on most private fund reports. In plain terms, it answers one question: for every dollar investors have paid into the fund, how much value exists today, counting both the cash already returned and the estimated value of what the fund still holds.
If you work in fund administration, PE or VC operations, or LP reporting, the practical question is not just what the acronym stands for. It is how the number is produced from capital account data, how it differs from DPI, what a reasonable figure looks like at a given point in a fund’s life, and where the multiple can mislead.
This article covers the formula, a worked example, the TVPI vs DPI comparison, benchmark context, the metric’s limitations, and the reporting mechanics behind a defensible number.
Note: this is general information. Calculation conventions vary by fund documents, valuation policy, and reporting standards.
One source of truth for fund performance reporting
Capital accounts, allocations, and investor statements on a unified accounting platform.
What is TVPI?
TVPI stands for total value to paid-in capital. It is expressed as a multiple, such as 0.9x or 1.6x, and it measures the total value a fund has generated relative to the capital investors have actually contributed.
The “total value” in the numerator has two parts. The first is cumulative distributions: all cash and any in-kind securities the fund has already returned to investors. The second is residual value: the current fair value, usually the net asset value, of the investments the fund still holds. The first part has happened. The second part is an estimate.
The denominator is paid-in capital: the capital investors have actually contributed to date. It is not the same as committed capital, because most funds call capital gradually over several years.
The TVPI formula
TVPI = (Cumulative distributions + Residual value) ÷ Paid-in capital
Because DPI (distributions to paid-in) and RVPI (residual value to paid-in) share the same denominator, TVPI is also the sum of those two multiples:
TVPI = DPI + RVPI
This identity is more than algebra. It turns one headline number into two separate questions a reviewer can actually answer: how much of the multiple has come back as cash, and how much still depends on the manager’s valuation of the remaining portfolio. Two funds can report the same TVPI with very different answers to those questions.
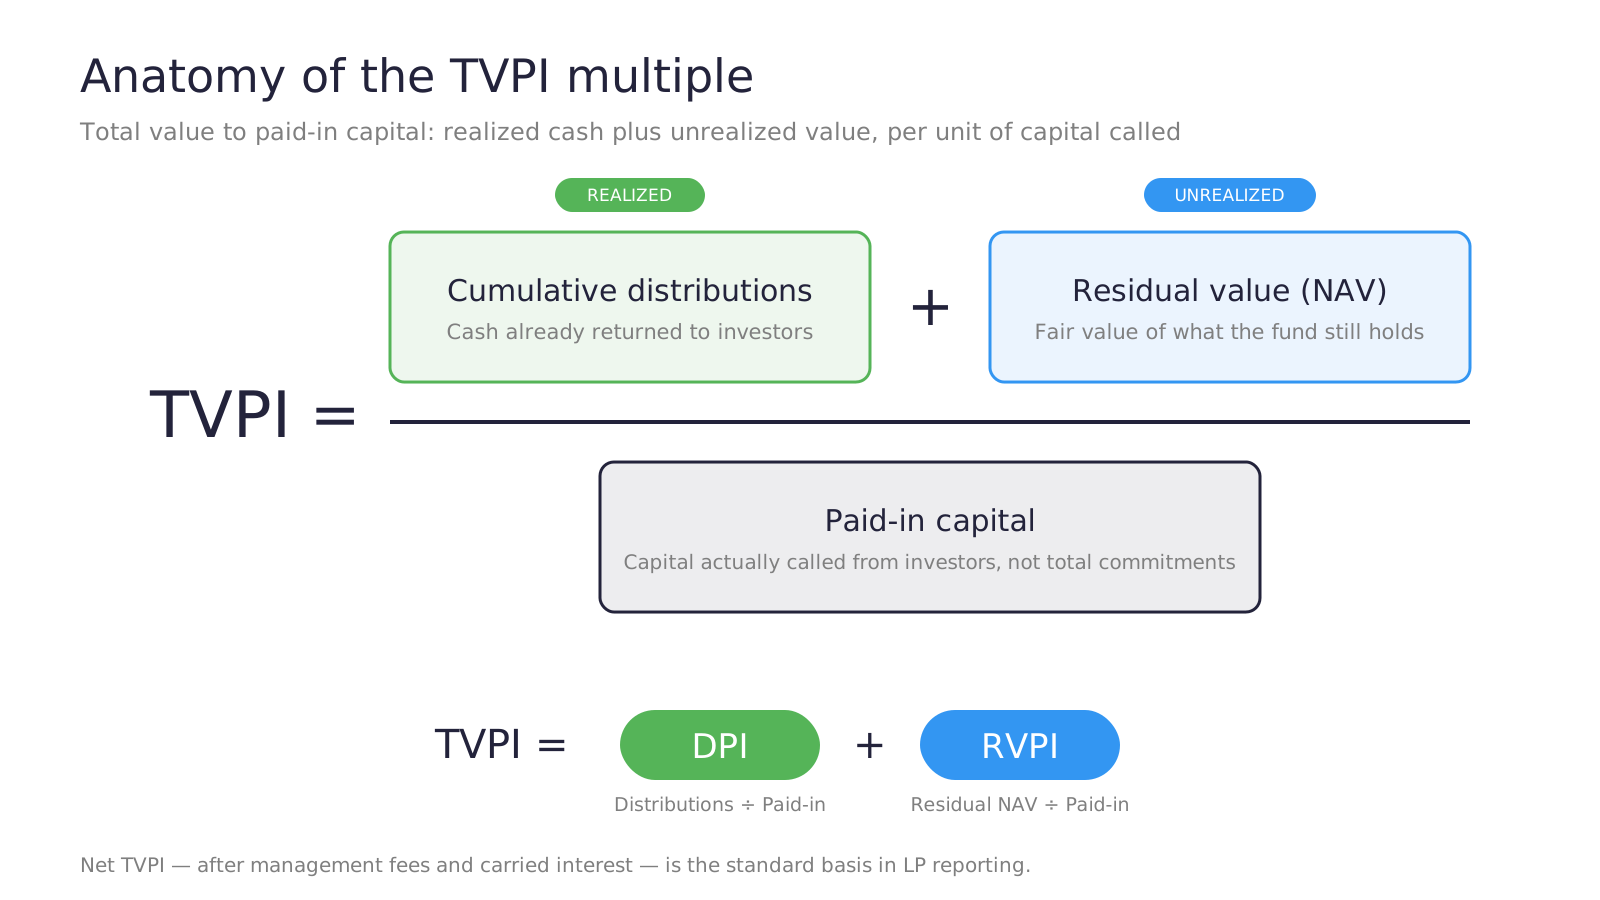
The TVPI multiple combines realized distributions and unrealized residual value over paid-in capital.
What counts as paid-in capital
Most disagreements about a fund’s TVPI are not about the numerator. They are about the denominator. Paid-in capital generally means cumulative capital called from investors, and under most conventions that includes amounts drawn to pay management fees and fund expenses when those are called within the commitment.
Two items need a written convention because practice varies. The first is recallable distributions: amounts returned to investors that the fund may call again. When they are recalled, some managers add them back to paid-in capital and some do not, and the choice changes both DPI and TVPI. The second is recycled capital, where proceeds are reinvested rather than distributed. The safe operational rule is the same one that applies to any reporting definition: write it down, apply it consistently period after period, and disclose it wherever the multiple appears.
Net vs gross TVPI
Net TVPI is calculated after management fees, fund expenses, and carried interest. Gross TVPI is calculated before that fee drag, and it usually appears at the deal or portfolio level rather than the fund level. In LP reporting, TVPI without a qualifier almost always means net TVPI, because that is the value that actually accrues to investors. The practical rule: never present gross and net multiples side by side without labeling each one, especially in track records.
Worked example (simple numbers)
Assume a reporting date of quarter-end for a fund with $100.0M committed.
- Paid-in capital to date: $80.0M
- Cumulative distributions to investors: $40.0M
- Residual value (NAV) of remaining holdings: $88.0M
TVPI = ($40.0M + $88.0M) ÷ $80.0M = 1.60x
DPI = $40.0M ÷ $80.0M = 0.50x. RVPI = $88.0M ÷ $80.0M = 1.10x. Check: 0.50x + 1.10x = 1.60x.
Read as a sentence: the fund has generated $1.60 of value for every dollar called, of which $0.50 has been returned in cash and $1.10 rides on the current marks. If a reported TVPI does not tie to your own calculation, the identity tells you where to look: the distributions history, the NAV as of the same date, or the paid-in definition.
TVPI vs DPI: what is the difference?
DPI, or distributions to paid-in capital, divides cumulative distributions by paid-in capital. It is sometimes called the realization multiple or the cash-on-cash multiple, and it is the part of TVPI that has already happened.
The difference in one sentence: TVPI includes value that has not been realized yet, while DPI counts only what has actually been paid out. DPI is also typically a net figure by construction, since distributions reach investors after fees and carried interest have been taken.
| Aspect | TVPI | DPI |
| What it includes | Distributions plus residual value (realized + unrealized) | Distributions only (realized) |
| Question it answers | How much total value exists per dollar paid in, right now | How much cash has actually come back per dollar paid in |
| Sensitivity to valuation marks | High — the RVPI component moves with NAV | None — based on cash flows that have occurred |
| Most informative | Early and mid fund life, before meaningful exits | Harvest period and later, once exits begin |
| Typical reporting basis | Net of fees and carry (state gross explicitly) | Net by construction — distributions arrive after fees and carry |
| At end of fund life | Converges to DPI once residual value reaches zero | Becomes the fund’s final multiple |
The two metrics also trade places over a fund’s life. In the early years, DPI sits at zero and TVPI is driven almost entirely by valuation marks. As exits begin, distributions convert RVPI into DPI. By wind-up, nothing unrealized remains and TVPI equals DPI. That convergence is why LPs treat DPI as the final word and interim TVPI as a progress report.
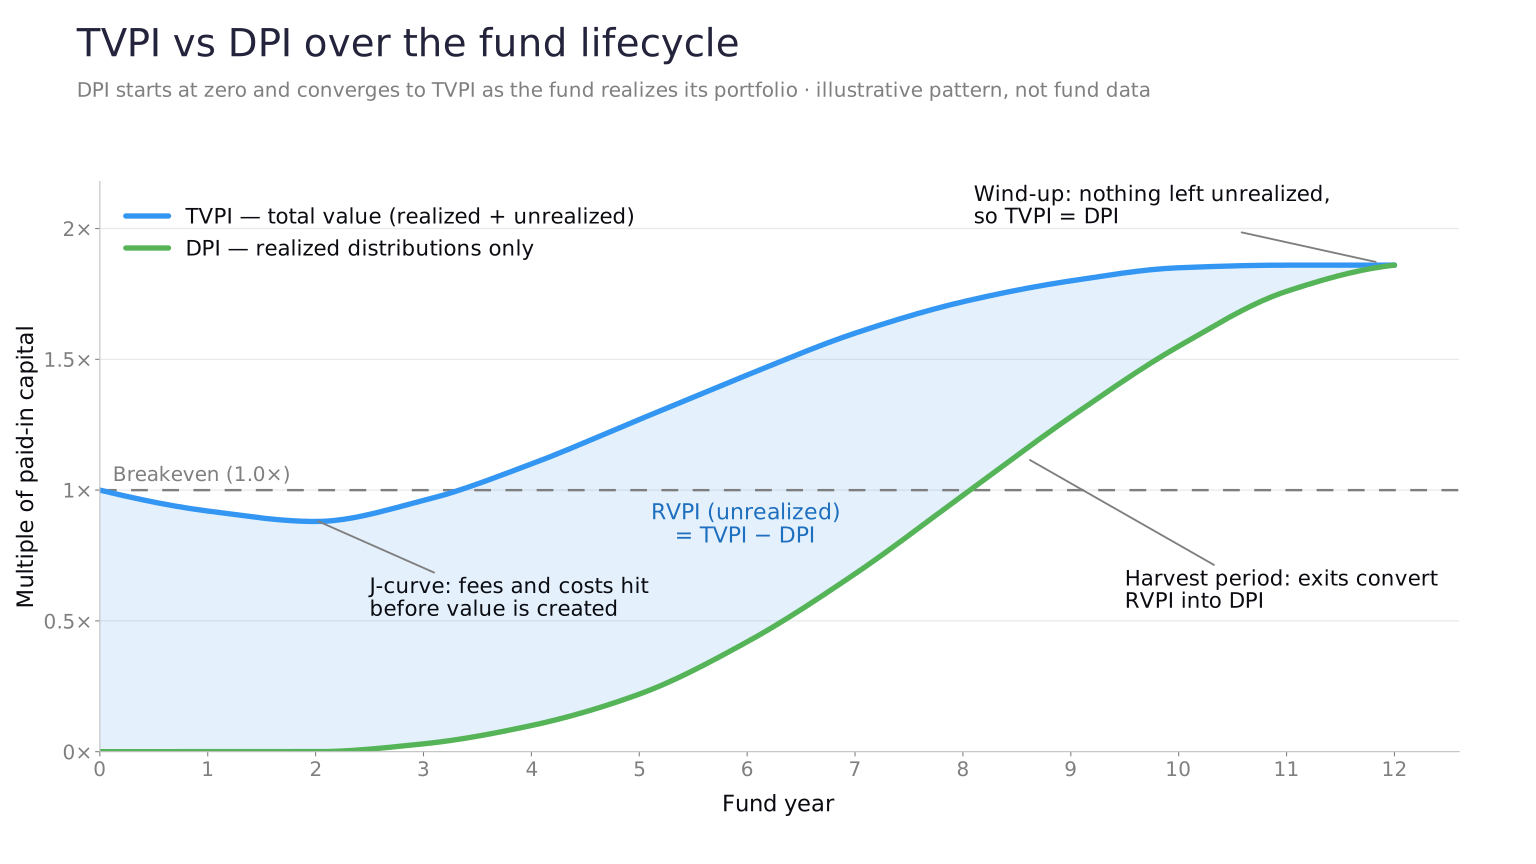
Illustrative lifecycle: DPI starts at zero and converges to TVPI as the fund realizes its portfolio.
The gap between the two lines has been the defining LP story of recent years. In venture, distributions have lagged well behind paper value: as of Q1 2026, median DPI for the 2019 and 2020 fund vintages on Carta was still barely above zero, and fewer than 20% of funds from the 2017 and 2018 vintages had reached a 1.0x DPI. When realizations are scarce, the difference between a fund’s TVPI and its DPI is exactly the part of the story that still has to be proven.
TVPI vs RVPI
RVPI is not an alternative to TVPI; it is the unrealized component inside it. It becomes a diagnostic on its own late in a fund’s life: when a mature fund’s TVPI is still dominated by RVPI, the portfolio is aging without exits, and the marks supporting that residual value deserve a closer look.
TVPI vs MOIC
TVPI and MOIC (multiple on invested capital) are often used interchangeably, and industry templates such as ILPA’s pair them as “TVPI/MOIC” at the fund level. In practice, though, MOIC frequently appears as a deal-level, gross multiple on invested capital, while TVPI is a fund-level, net multiple on paid-in capital, a denominator that also includes capital called for fees and expenses. The two can differ materially for the same fund. The safe habit whenever either term appears: state the basis (gross or net) and the denominator (invested vs paid-in) rather than assuming they match.
TVPI vs IRR
TVPI is a multiple; IRR is an annualized rate. TVPI tells you how much value was created but not how fast: a 1.5x achieved in three years and a 1.5x achieved in ten years produce the same multiple and very different IRRs. IRR, in turn, is sensitive to cash flow timing and can be flattered by subscription credit lines that delay capital calls. Delayed calls also shrink paid-in capital early in a fund’s life, which can nudge interim multiples, which is one reason the current ILPA reporting standard asks for performance with and without the effect of fund-level subscription facilities. Neither metric is sufficient alone; read TVPI, DPI, and IRR together.
TVPI benchmarks: what is a good TVPI?
There is no universal “good” TVPI. The same number reads completely differently depending on four pieces of context: how old the fund is, what vintage year it belongs to, what strategy it runs, and whether the figure is gross or net.
Fund age matters because of the J-curve. Fees and expenses are drawn from day one while investments are still held near cost, so a young fund’s net TVPI often sits below 1.0x before climbing. A 1.4x in year three and a 1.4x in year nine are different stories: the first is on pace, the second suggests the fund may finish near that level. Vintage matters because funds raised in the same year invested through the same entry prices and exit markets; comparing across vintages mostly measures the market, not the manager. And strategy matters because return distributions differ: dispersion between the best and worst funds is far wider in venture than in buyout, which makes quartile position within the peer group more informative than the raw multiple.
In practice, LPs benchmark a fund’s TVPI against funds of the same vintage and strategy, using quartile and decile breakpoints from providers such as PitchBook, Cambridge Associates, Preqin, and MSCI. PitchBook’s benchmark methodology is a useful reference point for what those datasets contain: multiples reported net of fees and accrued carry, presented both pooled and by vintage-year quartile.
Reference points from recent data
The table below shows one public, regularly refreshed reference set: net TVPI percentiles for venture funds on the Carta platform, by vintage year. These figures move every quarter and are shown here for orientation, not as targets.
| Fund vintage | Median net TVPI | 75th percentile | 90th percentile |
| 2017 | 1.76x | 2.27x | 3.52x |
| 2018 | 1.38x | 1.97x | 3.07x |
Source: Carta, VC Fund Performance report. Data as of September 30, 2025; funds on the Carta platform; net of fees and carried interest. Refresh this table when Carta publishes each quarterly report.
A few widely used orientation points sit around figures like these. A net TVPI of 1.0x is breakeven after fees. In venture, a 3.0x TVPI is often treated as the threshold for an excellent fund, and as the percentiles above show only the top decile of late-2010s vintages is tracking there. Buyout return distributions are tighter, so the gap between a median and a top-quartile buyout fund is smaller than the equivalent gap in venture.
Benchmarking mistakes to avoid
- Comparing funds of different ages. A year-3 fund against a year-10 fund measures the J-curve, not skill.
- Mixing gross and net. A gross TVPI will beat a net benchmark by construction; confirm the basis before comparing.
- Treating interim TVPI as final. Until residual value is realized, the multiple can move in either direction.
- Ignoring DPI. A fund at the median on TVPI but near zero on DPI carries more uncertainty than the headline suggests.
- Cherry-picking the peer group. Strategy, geography, and fund size should match the fund being evaluated, and the same peer set should be used period after period.
Limitations of TVPI
TVPI is popular because it is simple: two inputs from the capital account, one division. The same simplicity creates four limitations worth naming explicitly.
First, the residual value component is an estimate. Unrealized holdings are carried at fair value under the fund’s valuation policy, and for hard-to-value assets those marks involve judgment. A TVPI is only as reliable as the NAV inside it, and marks can be stale between valuation events.
Second, TVPI ignores the time value of money. It gives no credit for returning capital quickly and no penalty for taking a decade to do it, which is why it is always read alongside IRR.
Third, interim TVPI can be managed. Because the unrealized component moves with valuation decisions, a mid-life multiple can be presented optimistically without any cash changing hands. DPI is the counterweight: it cannot be marked up.
Fourth, the denominator is not fully standardized. Recallable distributions, recycled capital, and the treatment of fee drawdowns vary across managers, which quietly erodes comparability between funds that report the “same” metric.
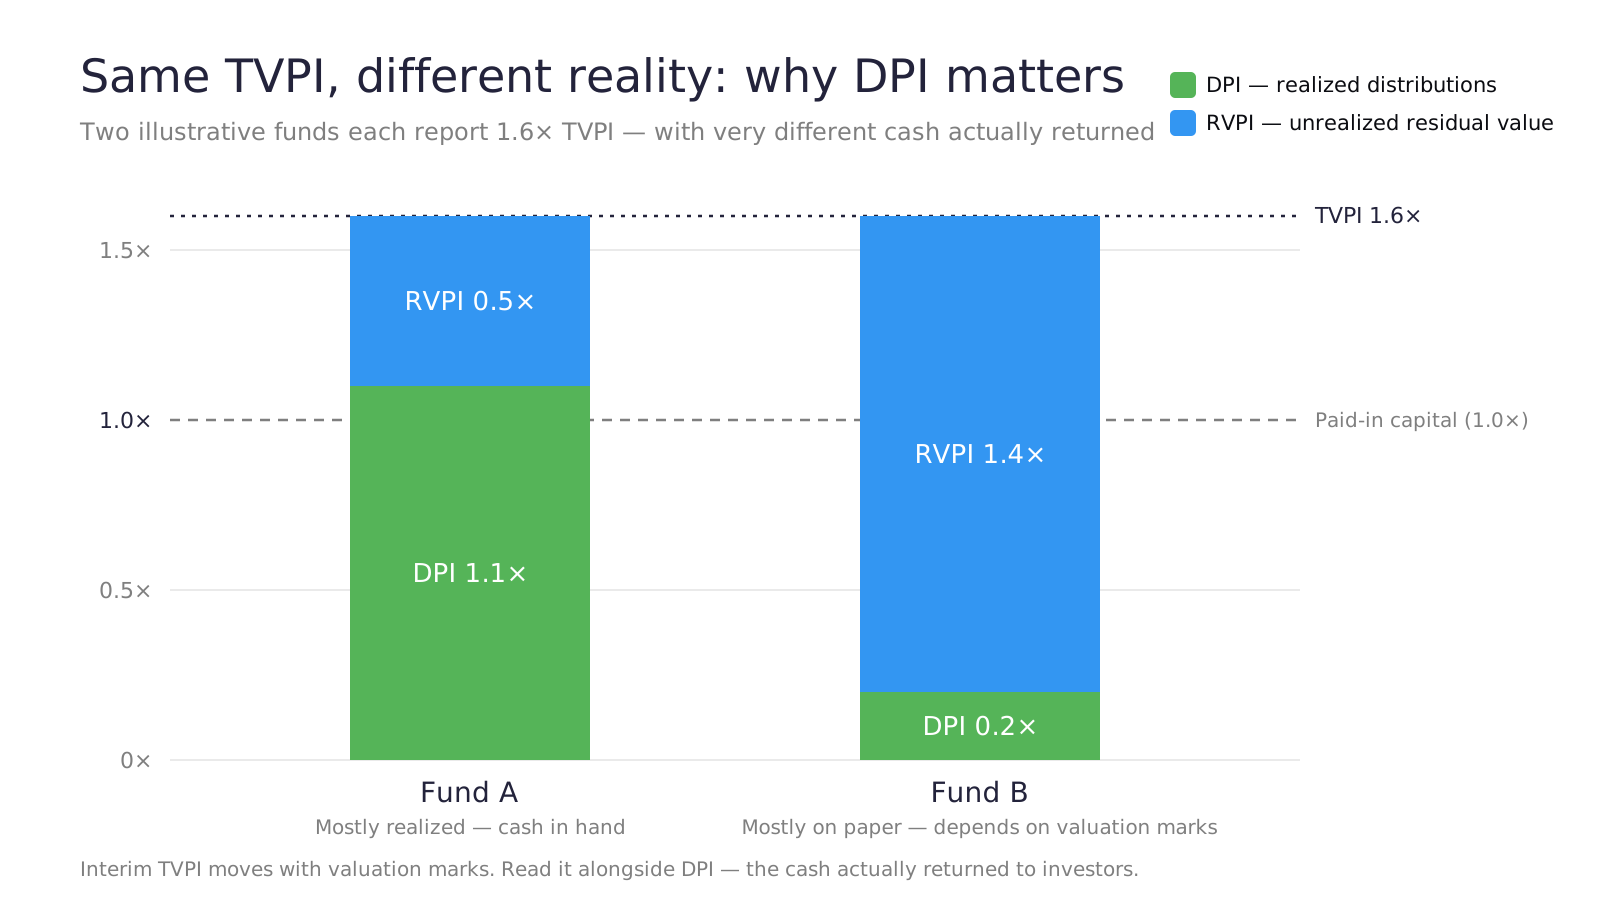
Two funds can report an identical TVPI with very different amounts of realized cash behind it.
TVPI in LP reporting and operations
TVPI appears in quarterly reports, capital account statements, fundraising track records, and due diligence questionnaires. For the teams producing those documents, the metric is less a formula than a data problem: every input traces back to recorded capital activity and a NAV, and all of it has to reconcile.
The ILPA Performance Template raises the bar
The reporting standard for this metric changed recently. ILPA’s Performance Template, released in 2025, standardizes how funds present IRR and TVPI/MOIC: gross and net figures, each shown both with and without the impact of fund-level subscription facilities, in one of two calculation methodologies (granular, based on itemized cash flows, or gross-up, based on aggregated ones). The template applies to funds commencing operations from Q1 2026, with first delivery to LPs expected in Q1 2027.
The operational consequence sits in one feature: the template includes a cash flow table designed so LPs can recalculate the fund’s performance metrics themselves. A TVPI that used to live in a spreadsheet summary now has to be reproducible from transaction-level data, with every capital call and distribution classified by type. That is a data hygiene requirement as much as a reporting one.
Fund-level vs investor-level TVPI
Fund-level TVPI is one number; investor-level multiples are many. Each LP has its own paid-in and distribution history: later closers pay in on a different schedule, transfers reset positions, and fee terms differ across classes and side letters — so an individual investor’s TVPI routinely differs from the fund’s. Statements need to hold both views, and the investor-level figures must tie back to the fund-level number through the allocations. Quoting the fund multiple to an LP whose own multiple is lower is a reliable way to generate a difficult call.
The data behind a defensible TVPI
A multiple that survives an audit or an LP recalculation rests on a small set of disciplines:
- Transaction typing. Every distribution classified — return of capital, gain, income — and every capital call classified by purpose (investment, fees, expenses).
- Recallable flags. Recallable distributions identified at the moment they are made, so later recalls do not double-count in either direction.
- Consistent as-of dates. The NAV in the numerator and the cash flow history must share the same cut-off; mismatched dates are the fastest way to create an unexplainable multiple.
- One paid-in definition. Documented once, applied to every report, every period.
- An audit trail. Who changed a mark or reclassified a flow, and when. This is the evidence reviewers ask for first.
Common pitfalls when calculating and reporting TVPI
Pitfall 1: Two reports, two paid-in definitions
What it looks like: the pitch book shows a higher TVPI than the quarterly report for the same date. How it happens: one calculation treats recalled distributions or fee drawdowns differently from the other. How to prevent it: a single documented paid-in definition, referenced by every report that shows the multiple.
Pitfall 2: Recallable distributions double-counted
What it looks like: DPI rises when a distribution goes out, then paid-in fails to rise when the same amount is recalled — or rises twice. How it happens: recallable flags are missing at the transaction level, so the convention is applied from memory. How to prevent it: flag recallable amounts when the distribution is booked and let the reporting logic apply the documented convention automatically.
Pitfall 3: Gross and net mixed in one track record
What it looks like: Fund I shows 2.1x and Fund III shows 1.4x, and the difference is basis, not performance. How it happens: older figures were kept gross while newer reporting moved to net, and nobody relabeled the history. How to prevent it: label every multiple, and restate track records on a single basis before they leave the building.
Pitfall 4: NAV and cash flows on different dates
What it looks like: TVPI moves quarter to quarter for no reason anyone can explain. How it happens: the residual value is taken from the latest valuation while distributions are cut off at period-end, or vice versa. How to prevent it: one as-of date for every input, verified before the multiple is published.
Pitfall 5: Fund multiple quoted to an individual investor
What it looks like: an LP disputes a reported TVPI using their own capital account, and they are right. How it happens: reports show the fund-level figure without the investor-level view. How to prevent it: produce both, and reconcile investor-level multiples to the fund-level number through the allocations each period.
Pitfall 6: Interim TVPI presented without context
What it looks like: a 1.2x is described as underperformance for a fund in year two, or as success for a fund in year eleven. How it happens: the multiple travels without its vintage, age, and DPI. How to prevent it: never publish TVPI alone; pair it with fund age, vintage-year peer context, and the realized DPI beside it.
How FundCount supports TVPI reporting
A defensible TVPI is easiest when capital activity, valuations, allocations, and reports come from a single source of truth. FundCount is back-office accounting and investment analysis software that integrates portfolio, partnership, and general ledger accounting on one platform, which maps to the mechanics of this metric in several ways:
- Partnership accounting maintains each investor’s capital account — contributions, distributions, allocations, and fee terms — which is exactly the data TVPI, DPI, and RVPI are computed from, at both fund and investor level.
- An integrated general ledger and portfolio accounting core keeps the residual NAV and the cash flow history on the same books and the same as-of dates, so multiples tie out instead of drifting between systems.
- Configurable reporting lets teams present performance consistently across quarterly packs, statements, and track records — including the gross/net and with/without breakouts that current LP expectations and the ILPA template call for.
- The Investor Portal delivers statements and reports to LPs with controlled distribution, keeping the investor-level view aligned with the fund-level one.
One platform for fund accounting and investor reporting
Keep capital accounts, NAV, and performance multiples tied to the same source of truth.
Conclusion
TVPI is the fastest read on a private fund’s value creation, and the identity behind it — TVPI = DPI + RVPI — is the fastest way to interrogate it. The multiple earns its place on the first page of every report, but it only means something in context: net of fees, benchmarked against the same vintage and strategy, read next to DPI and IRR, and built on capital account data that reconciles to a single as-of date. For the teams producing the number, the discipline is the same one that governs any reporting metric: define it once, classify every transaction that feeds it, and be ready for the day an LP recalculates it.
FAQ
What is a good TVPI?
It depends on fund age, vintage, and strategy. A net TVPI of 1.0x is breakeven after fees. Young funds often sit below 1.0x because of the J-curve. Mature funds are judged against same-vintage, same-strategy peers: in venture, 3.0x is often cited as excellent, while median multiples for recent vintages sit well below that. Quartile position within the peer group is more informative than the raw number.
What is the difference between TVPI and DPI?
TVPI counts both the cash a fund has distributed and the estimated value of what it still holds; DPI counts only the cash distributed. DPI starts at zero, rises as the fund exits investments, and equals TVPI once the fund is fully realized. TVPI shows the full picture earlier; DPI shows the part that can no longer change.
Is TVPI net of fees?
Usually. In LP reporting, TVPI without a qualifier almost always means net TVPI, calculated after management fees, fund expenses, and carried interest. Gross TVPI, calculated before those costs, appears mainly at the deal or portfolio level. Any track record or comparison should state which basis is being used.
Can TVPI go down?
Yes. The residual value component moves with the fund’s valuation marks, so write-downs reduce TVPI even when no cash moves. The realized component cannot fall, which is why a declining TVPI with a stable DPI points specifically at the unrealized portfolio.
Is TVPI the same as MOIC?
Not necessarily. The terms are often used interchangeably, and some templates pair them, but MOIC frequently refers to a deal-level, gross multiple on invested capital, while TVPI is a fund-level, net multiple on paid-in capital, which includes capital called for fees. Confirm the basis and the denominator before treating the two as equal.